Measuring fitness, not guessing.
Easy days stay easy and hard days stay hard when effort is measured. We used heart-rate zones for effort, and repeatable tests to see whether fitness was actually changing.
Heart-rate zones
The coached plan set zones as a percentage of maximum heart rate, retested when the maximum changed.
| Zone | Share of maximum | Used for |
|---|---|---|
| L1 | 60–69% | Easy aerobic work and recovery. |
| L2 | 70–80% | Steady aerobic endurance. |
| L3 | 85–92% | Tempo-intensity work. |
| L4 | 93–100% | Hard intervals. |
| L5 | Near maximum | Short, fast efforts, such as swim sprints. |
The tests
Aerobic tests at a fixed heart rate
Hold effort steady and watch speed change. We used a heart-rate cap based on the “180 minus age” rule: run pace per mile, bike watts and swim pace per 100 yards, repeated every four to six weeks.
Benchmarks and time trials
A five-mile indoor bike time trial at a set heart rate, ramp and power tests, a one-hour swim test, and swim, bike and run time trials before races.
The order used in the plan: benchmarks, then tempo, then speed, then time trials, then race pacing.
What the tests showed
- Run pace at a fixed heart rate improved about 7 to 14% within each season, then reset over the winter.
- Bike test watts peaked in 2014: 187 W for Sherwick and 149 W for Jami on the same day.
- Swim pace barely changed from 2012 to 2015, which made swimming our limiter.
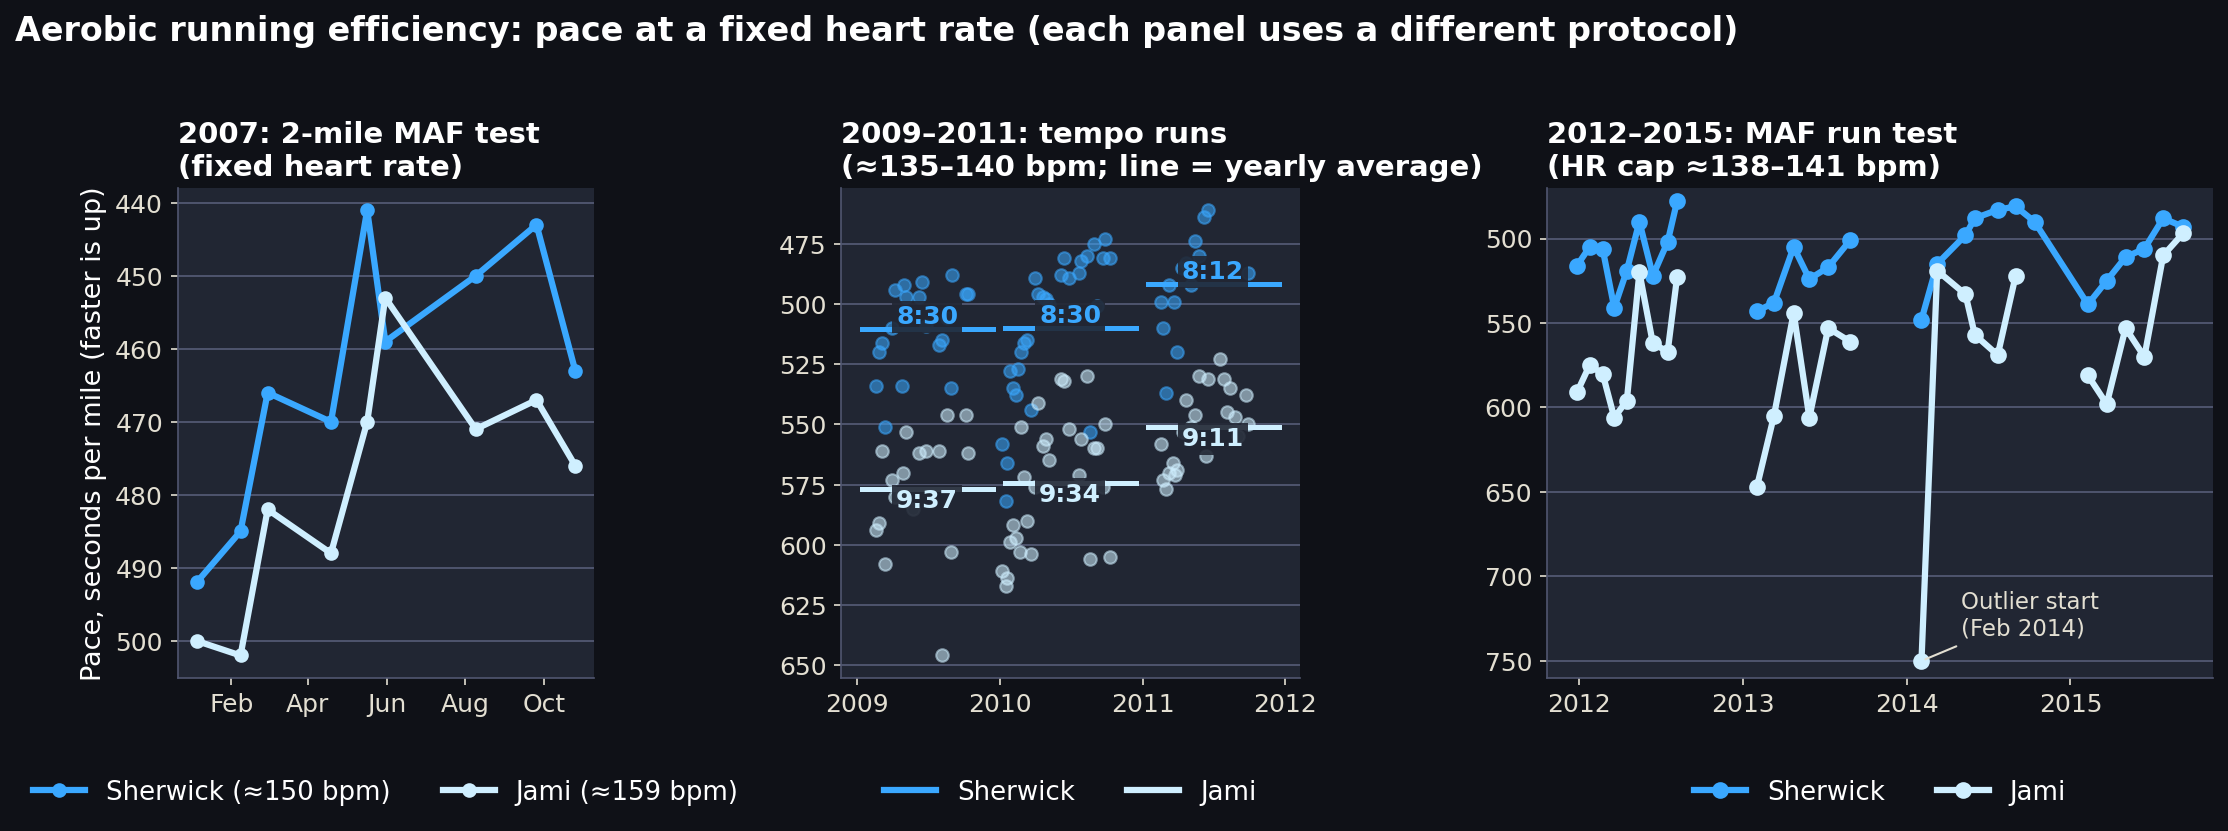
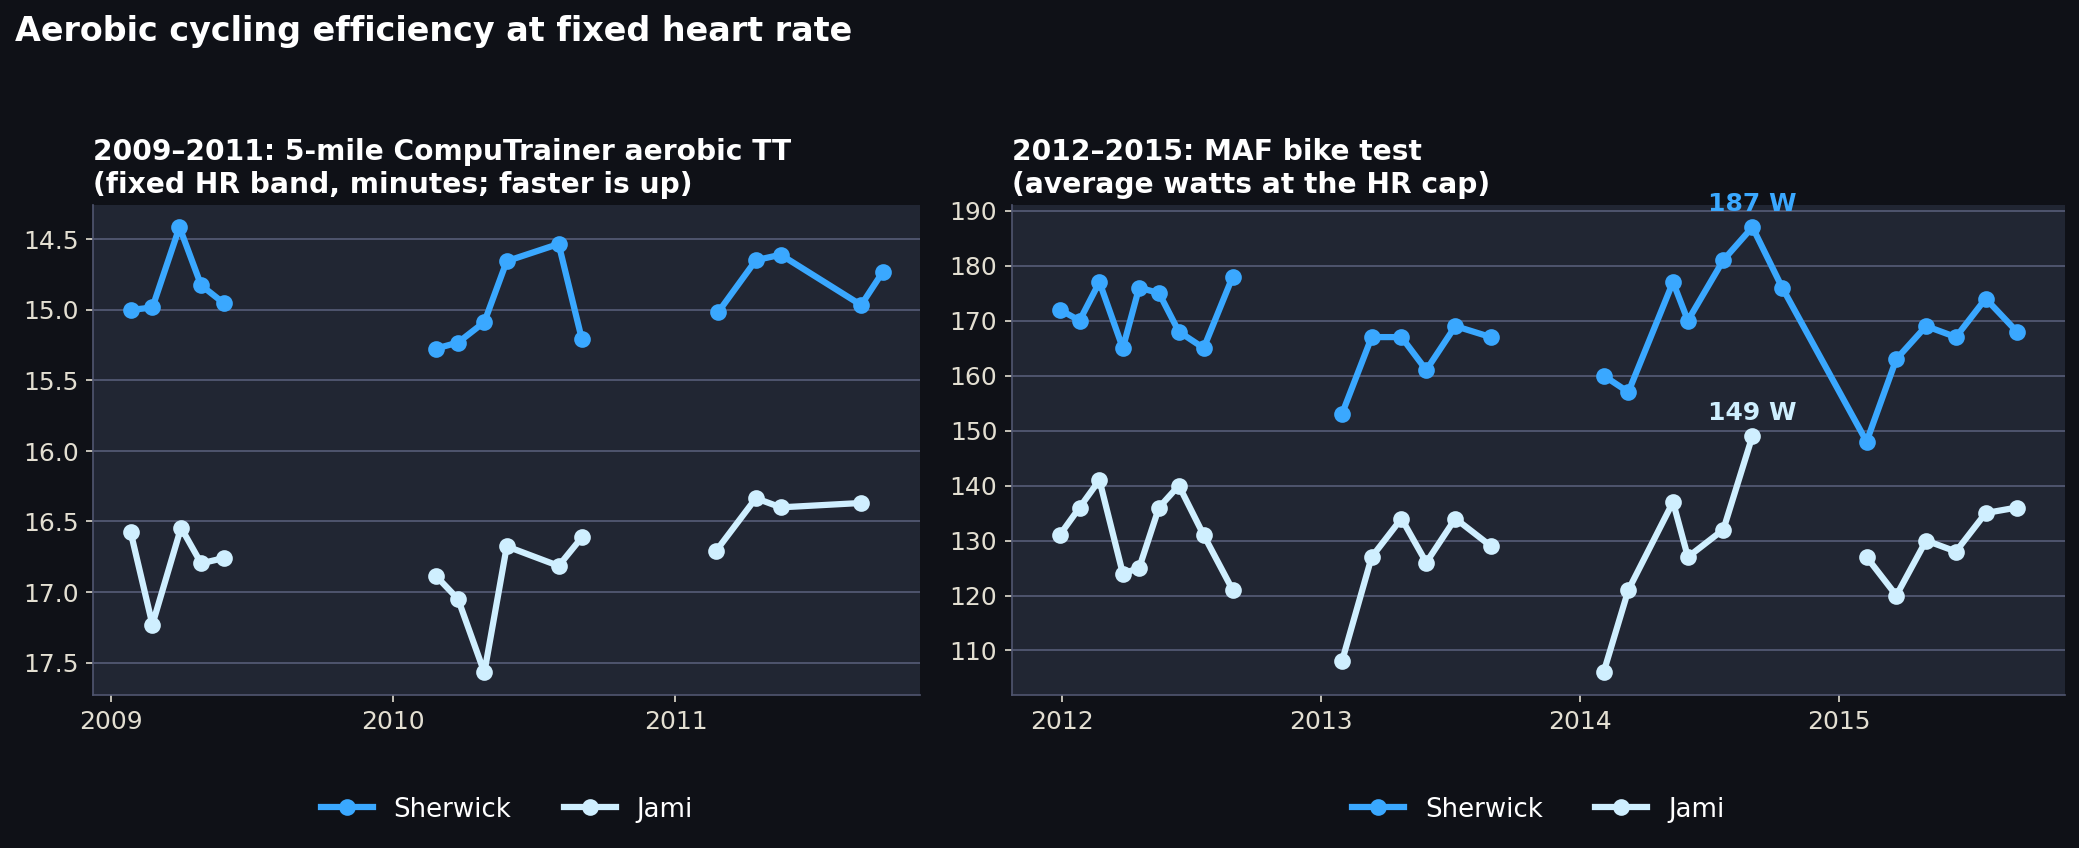
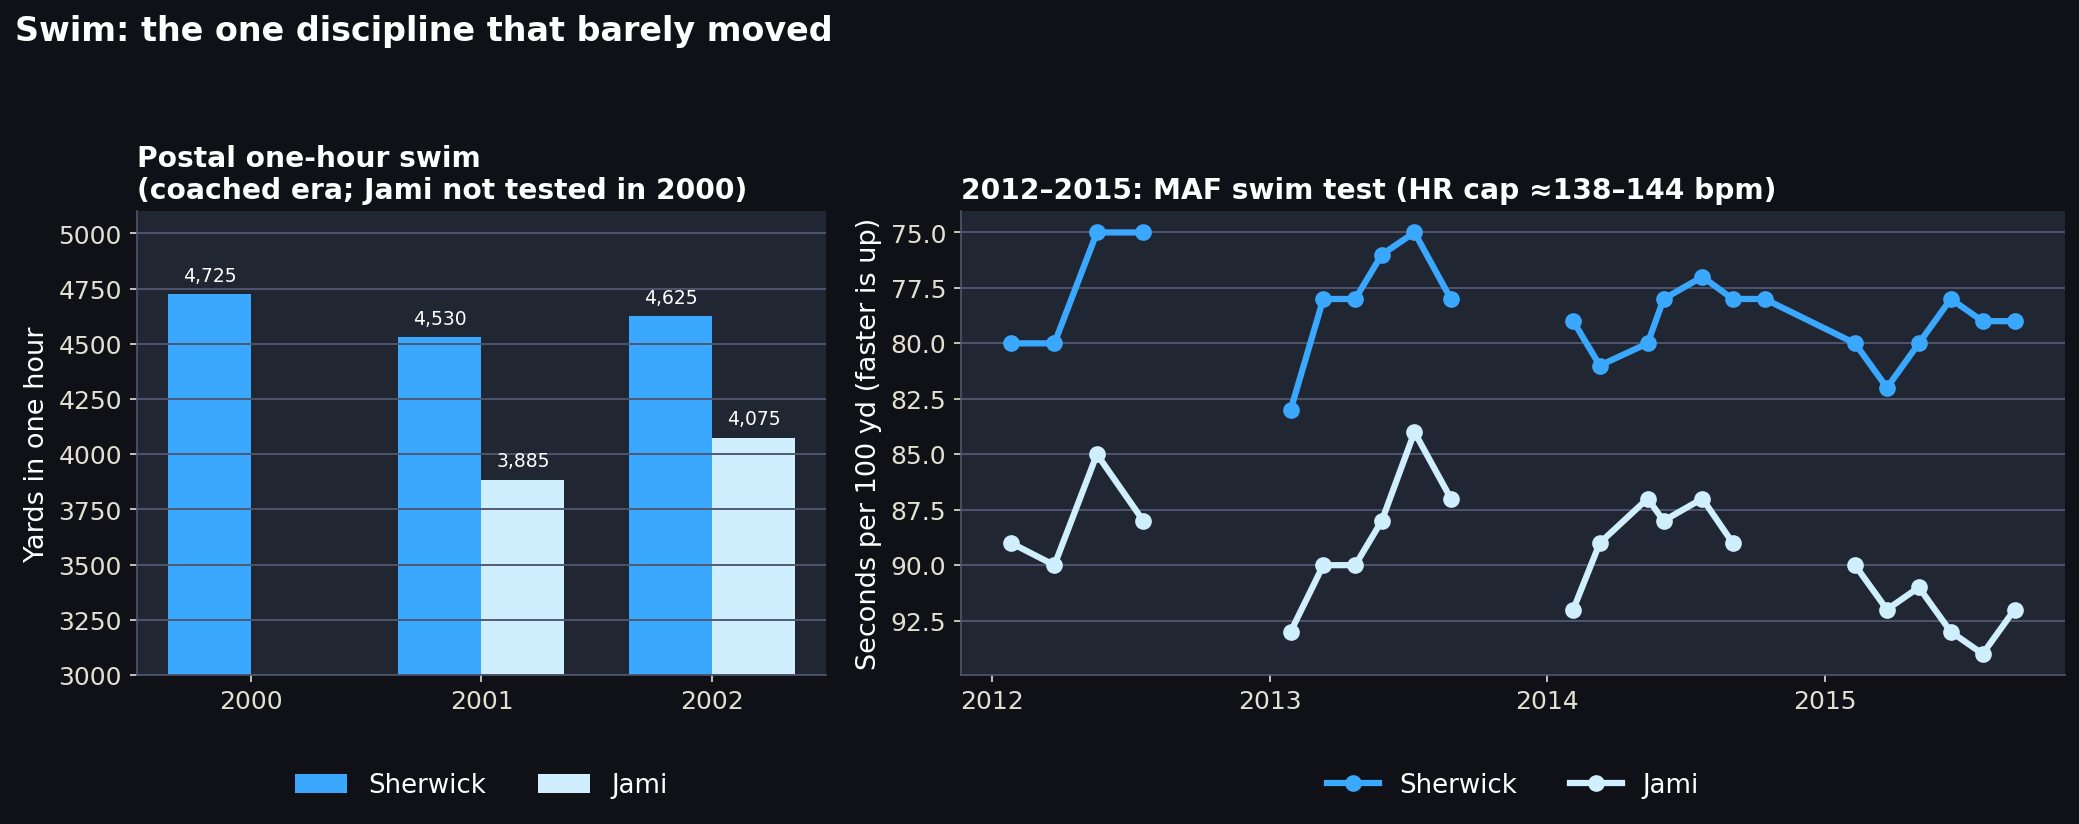
Test protocols changed between eras, so compare trends within a chart. See the training log analysis for how the tests lined up with results.